

Brief Summary:
- U.S. employment growth returned to ‘normal’ after severe winter weather delivered lacklustre figures.
- Confidence over stronger than expected Australian data was quickly dashed as China posted negative trade numbers over the weekend. Chinese New Year disrupts trade numbers each year but that didn’t save commodity prices and global risk sentiment from a poor start to the week.
- The Reserve Bank of New Zealand will meet tomorrow morning at 07:00 AEST for its monthly interest rate decision. Market consensus is for a 25 basis point rise to 2.75%. The bank have stated, “There is a need to return interest rates to more normal levels, and the Bank expects to begin this adjustment soon.” Our view is that with inflation at 1.6%, below to 2.0% target, and the bank’s preference to stem currency appreciation, rates will not be raised yet.
China spoils Australian surprise
Data released on Thursday show Australian retail sales strengthened further in January. The sector grew by a robust 1.2% after only 0.5% was expected. The figure caps off the strongest six months of retail sales growth in recent history.
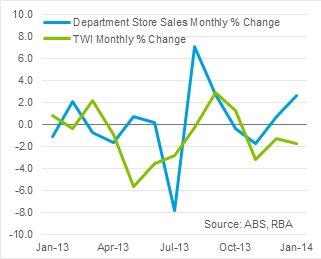 One relationship that examines the link between exchange rates and retail sales is shown to the right. Charted are department store sales and the RBA’s AUD Trade Weighted Index. We make the gentle inference that department store sales fall victim to international websites when the AUD is high. However, since prices in a foreign currency react immediately to the exchange rate, department store prices should immediately become more favourable as their prices are set for the season. The corollary, department store sales and the exchange rate should move in opposite directions when charted; which they generally do on the right. As rates stabilise and traditional merchants slowly increase their prices, we may see the preference for international purchases return and retail sales may again start to languish.
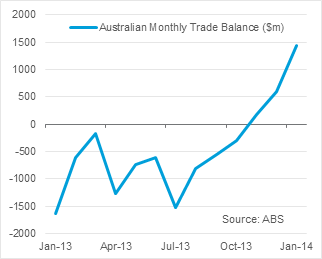 Australian trade data also smashed expectations with a trade surplus of $1.43 billion in January. The trade balance measures the value of exports less imports, with a surplus implying more exports and hence a net inflow of funds into Australia driving demand for the AUD. The strong figure was driven by robust exports of commodities like coal and iron ore with increased exports of gold. At the same time, imports of capital goods decreased significantly possibly reflecting slowing mining investment. The figure on the right shows how Australia’s trade balance has ramped up as the lower AUD has increased the value of exports.
Over the weekend, China’s trade data told the opposite story. China’s trade balance slipped unexpectedly into a deficit of $23.0 billion. It showed exports declined significantly and fears of a slowing China returned to markets. Commodity prices plummeted. Iron ore fell by 8.3% to be at its lowest level since October 2012 and copper also fell to its lowest level since July 2010. Mining stocks and the AUD followed, wiping out the gains made on the back of strong domestic data. Before assuming the worst, people should recall that Chinese trade figures in March and April are disrupted every year by Chinese New Year celebrations. A fundamental shift cannot be assumed from just one month and it is likely that the market jitters will be temporary.
Chinese industrial production, investment and retail sales data will be released tomorrow at 16:30 AEST. These figures are not normally disrupted as much as trade figures, however, it is possible that they may also undershoot expectations. We may see the AUD and commodities extend losses if the numbers disappoint.
Australian employment data from February will be released tomorrow at 11:30am. 15,300 new jobs are expected with the unemployment rate steady at 6.0%. Employment growth has disappointed almost every month recently. Another disappointing figure may extend the AUD losses, however, it is unlikely to break through recent support levels as the RBA have pledged a period of stable interest rates.
USD
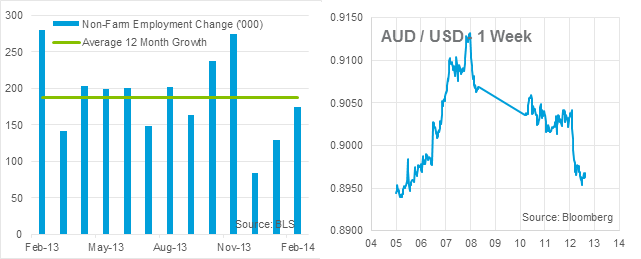
On Friday, The U.S. released monthly employment numbers that finally began to return to normal after two months of severe winter weather. 175,000 jobs were added in February and both January and December were revised upward. The data show the twelve month average remains robust at about 190,000 per month. Your correspondent was preparing an assortment of charts to present some viewpoints of the U.S. labour markets however was beaten to it by Quartz, a news and economics outlet. They present twelve simple, telling charts from the report here.
U.S. Retail Sales from February will be released on Thursday night; expectations are for 0.3% growth.
By Chris Chandler
Disclaimer: The above comments are only our views and should not be construed as advice. You should act using your own information and judgment. Although information has been obtained from and is based upon multiple sources the author believes to be reliable, we do not guarantee its accuracy and it may be incomplete or condensed. All opinions and estimates constitute the author’s own judgment as of the date of the briefing and are subject to change without notice. This information has been prepared for distribution via email and without taking into account investment objectives, financial situation and particular needs of any particular person. World First Pty Ltd makes no recommendations as to the merits of any financial product referred to in this article.