

Brief Summary:
- The AUD continued to decline this week in the wake of changing vibes from the U.S. Federal Reserve. We break down the events of last week below.
- The HSBC Flash China Manufacturing PMI strengthened this month to 50.5 from 50.3 last month. Despite the increase, the report commentary was less upbeat stating, “The picture is mixed, with new orders and new export orders registering some improvement. Meanwhile, the employment index declined further and disinflationary pressure intensified. Economic activity in the manufacturing sector showed signs of stabilization in September. However, overall the data still point to modest expansion. The property downturn remains the biggest downside risk to growth”
- PMI data from Europe was also released yesterday which showed confidence in the economic recovery has faded. Most indices were well clear of the 50.0 key expansion level but they have all languished back in recent months.
The dots and the carry trade
Last Thursday, the U.S. Federal Reserve held its highly anticipated monthly monetary policy decision. Markets have been active re-positioning since the first week of September when hints were dropped of a possible change in outlook and the release delivered pretty much as expected. Two participants dissented to the action, Richard W. Fisher and Charles I. Plosser, rather than the usual one, but there were no significant changes to the statement wording.
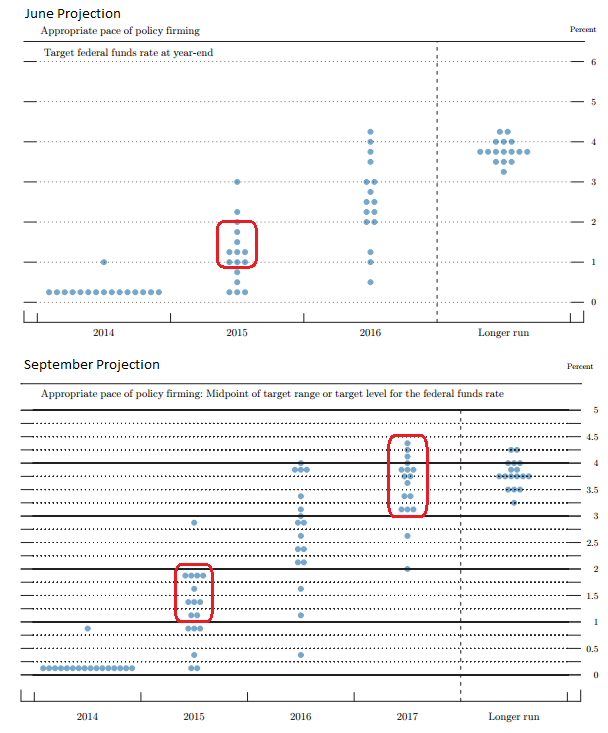
The September release contains official projections of future policy which are delivered four times per year. The release contains, among others, a convenient chart of Fed participants’ projections plotted as dots on a scale. Headlines read, ‘It’s all about the dots’ and the dots did confirm that official projections of the trajectory of interest rate rises have steepened. The survey on the timing of the first interest rate rise remained firmly as 2015.
Comparing the dots from June to September we can see that 2015 interest rate projections have stacked toward the top of the 1-2% bracket. 2016 remains up in the air, but 2017 shows the majority of projections stacked toward the upper end; over 3.00%.
This official release was largely pre-empted by foreign exchange markets and traders who positioned for an unwind in carry trades. A popular carry trade in markets today is to borrow in USD and carry assets in AUD. The dots affect the pricing of USD debt instruments used to fund carry trades. Higher dots mean a higher cost to borrow and prompt investors to take their profit on the carry trade. The reversal of these trades cause the AUD to fall, which increases volatility making it more expensive to hedge the AUD. This makes carry trades look even less attractive as a 5% currency swing can easily wipe out the profit on a carry trade. The snowball effect takes hold and we see a sharp decline in the AUD despite there being no data to justify the move.
Chris Chandler